
Created on 99designs by Vista
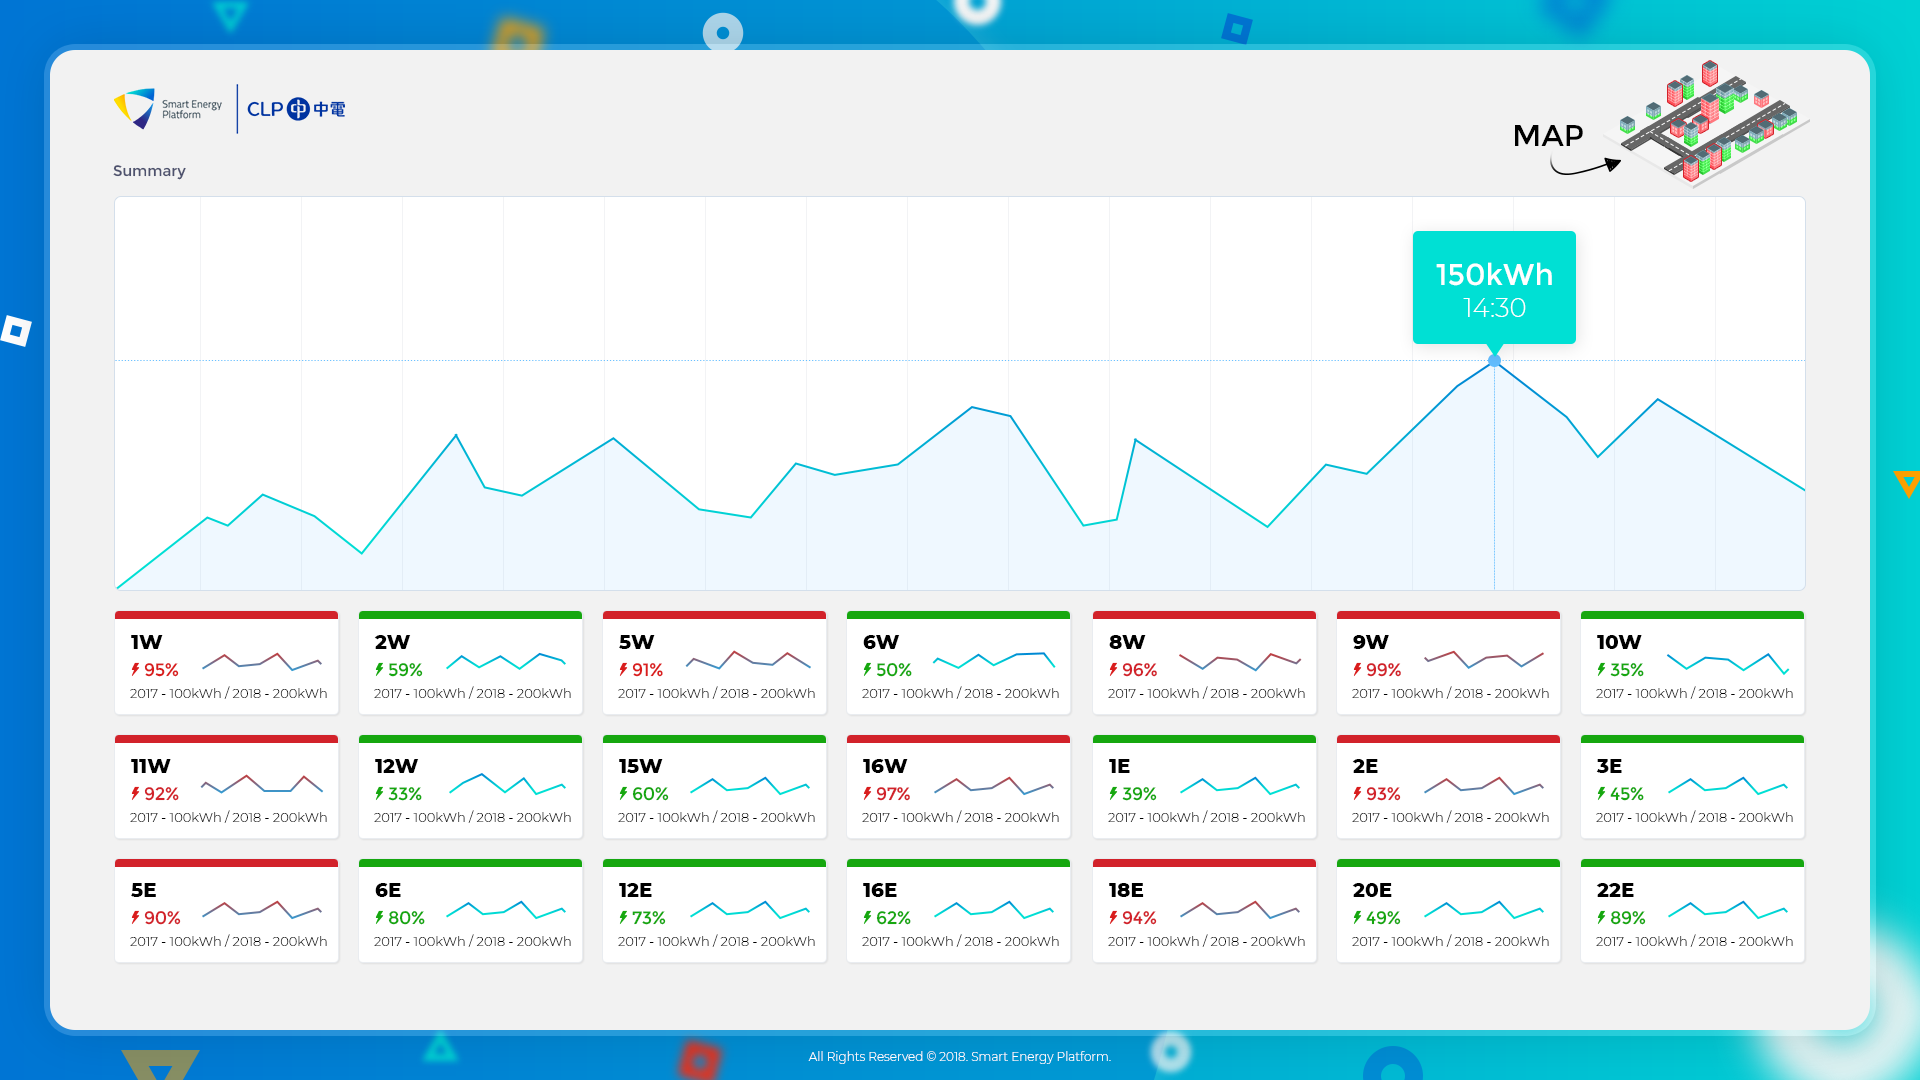
The main information this dashboard conveys is:
- How much each building is consuming
- Which buildings are consuming the most
- How did the energy consumption change from one year to another.
- How much this consumption translates in terms of charging an iphone for example, or a flight from Paris to New York, or how it translates to the energy consumption of a theme park such as Disneyland.